“It’s as if the Fed considers them foolish children, unable to rationally set the prices of securities so it must intervene. When the market has a tantrum, the benevolent Fed has a soothing yet enabling response.”-Seth Klarman
Dow: +114.67…
Nasdaq: +157.46… S&P: +24.90…
- Nasdaq Composite +19.8% YTD
- S&P 500 +1.3% YTD
- Dow Jones Industrial Average -7.4% YTD
- Russell 2000 -11.3% YTD
For a while there on Friday it looked like the Nazzy would go red, it came very close, but then the Nazzy (and everything else) woke up around 2:30, and rallied like a scalded monkey to basically close on the highs.
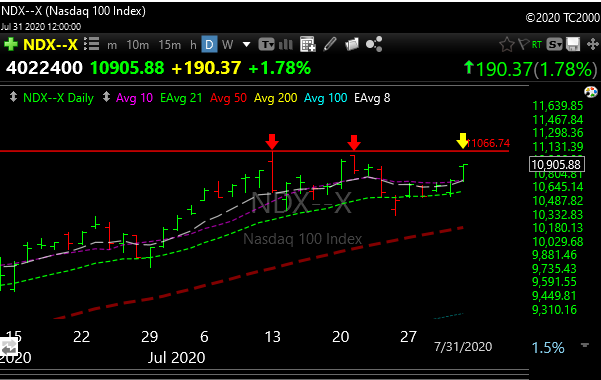
So after the double top that printed a week ago, the Nazzy now approaches a tripel top zone. If it breaks above the yellow arrow then more highs are most likely coming. If it fails, then maybe the start of a long-overdue pullback.
The chart is pretty, and bullish, so the question remains….how high can they go?
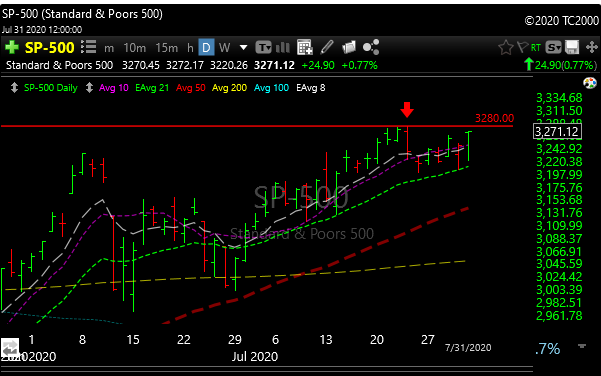
3280 is a big spot for SPX and we are so close.
The Russell 2000 is kind of the wild card. It’s trading at the bottom of the channel, so this is either a great buying opportunity (long TNA) or a great short (long TZA) if it breaks the uptrend line.
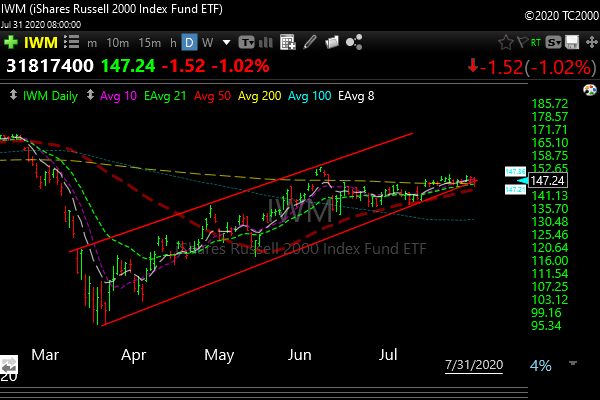
I don’t have a huge feel on the Russell 2000, but I will watch what KRE does as a possible “tell” As I have said many times, the regional banks are the largest holding in the Russell.
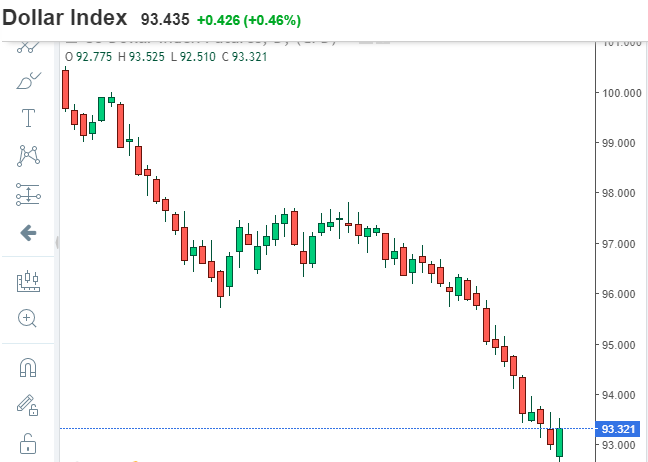
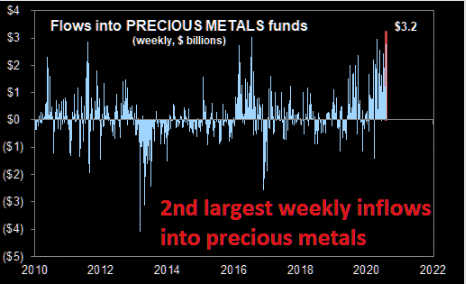
It was a historic week for the US dollar. It puked. It looks bad and it helped gold and silver go higher. However, as I said last week, it is very oversold, so a strong multi-week dead cat bounce could put a wet blanket on gold and silver. If it happens, it will be temporary in my opinion.
Notice the bullish reversal day on the Dollar on Friday. Right now that means nothing….needs a follow through nigher, but it bears watching.
Short bets in the US Dollar are the highest since August 2011, this can be a strong contrarian indicator.
The Euro is eating the dollar’s lunch.
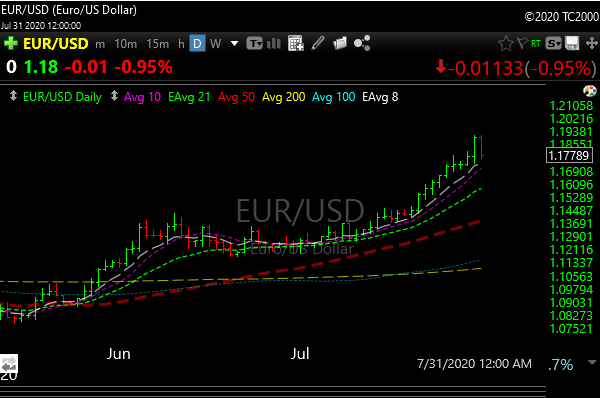
Because the dollar is weak, we saw…….
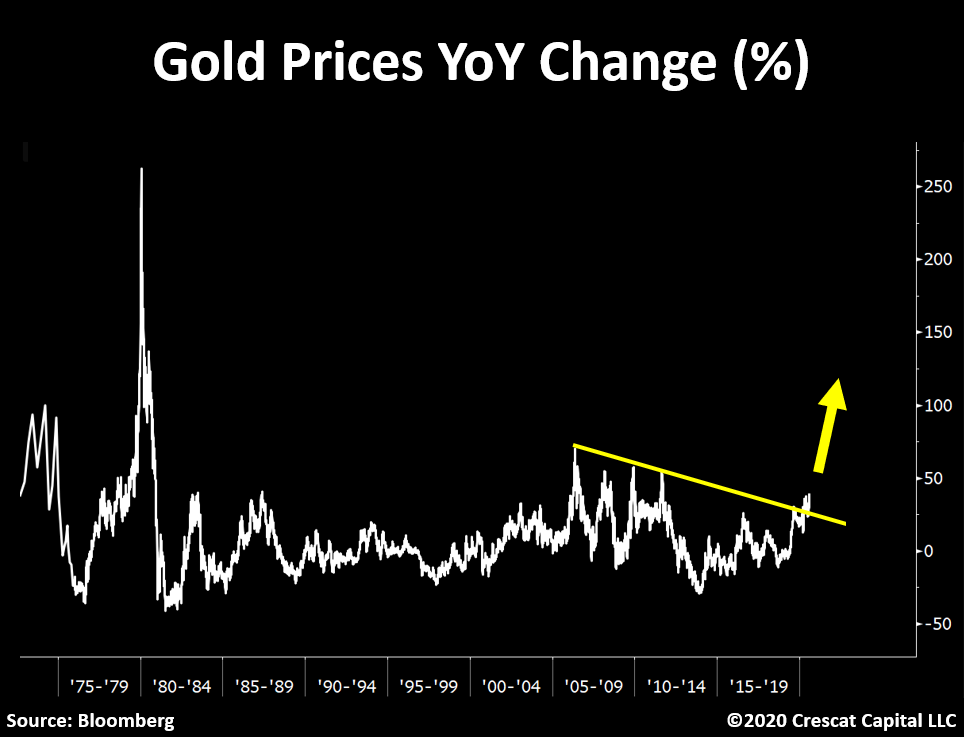
I know I am starting to sound like a gold bug, which I’m not, but below is a 45-year chart of gold futures. This positive downtrend breakout in the chart below could create some staggering moves to the upside over the next couple of years.
*UNITED STATES OUTLOOK REVISED TO NEGATIVE FROM STABLE BY FITCH.
We’re still AAA rated, but so were CDO’s.
The weak dollar has been commodities’ best friend over the last month.
Silver +33.3%
Gold +11.1%
Platinum +8.9%
Nickel +7.2%
Copper +7.1%
Palladium +6.3%
Zinc +6.0%
Lead +5.2%
Aluminum +5.1%
Cobalt +2.4%
The little pullback in gold and silver that we saw on Thursday was good for a trade because they popped back on Friday, but I still think we will get a shot at a better pullback to add to positions or start new ones at some point, especially if the greenback gets an oversold bounce. Nothing goes straight up, no matter how powerful it looks at the moment.
Gold’s Optimism Index has now reached one of the *highest* levels ever.
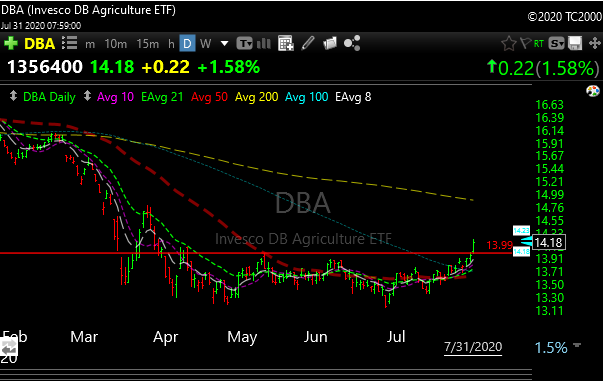
The commodities that hurt when they fall on your foot have obviously been stellar, but soft commodities are waking now (wheat, sugar etc,,,,,)
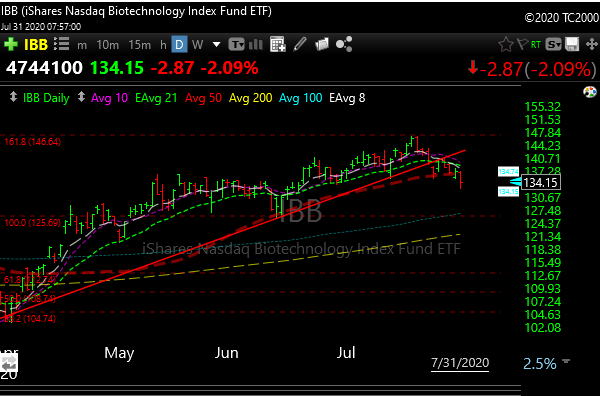
Biotech remained weak last week and both XBI and IBB closed below their respective 50-day moving averages. Key uptrend lines were also violated. Is it a buying opportunity or a short? I think it’s maybe too early to make that call.
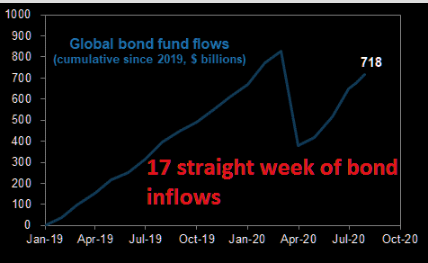
Treasury yields continued lower as we took out the April lows on a yield basis. Maybe an oversold bounce is coming, maybe not. I’m not a bond trader.
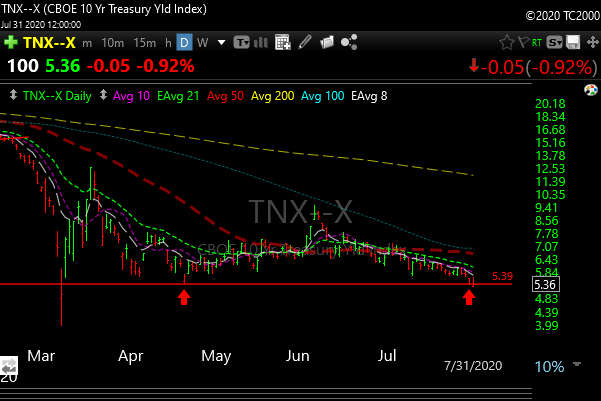
They still love bonds.
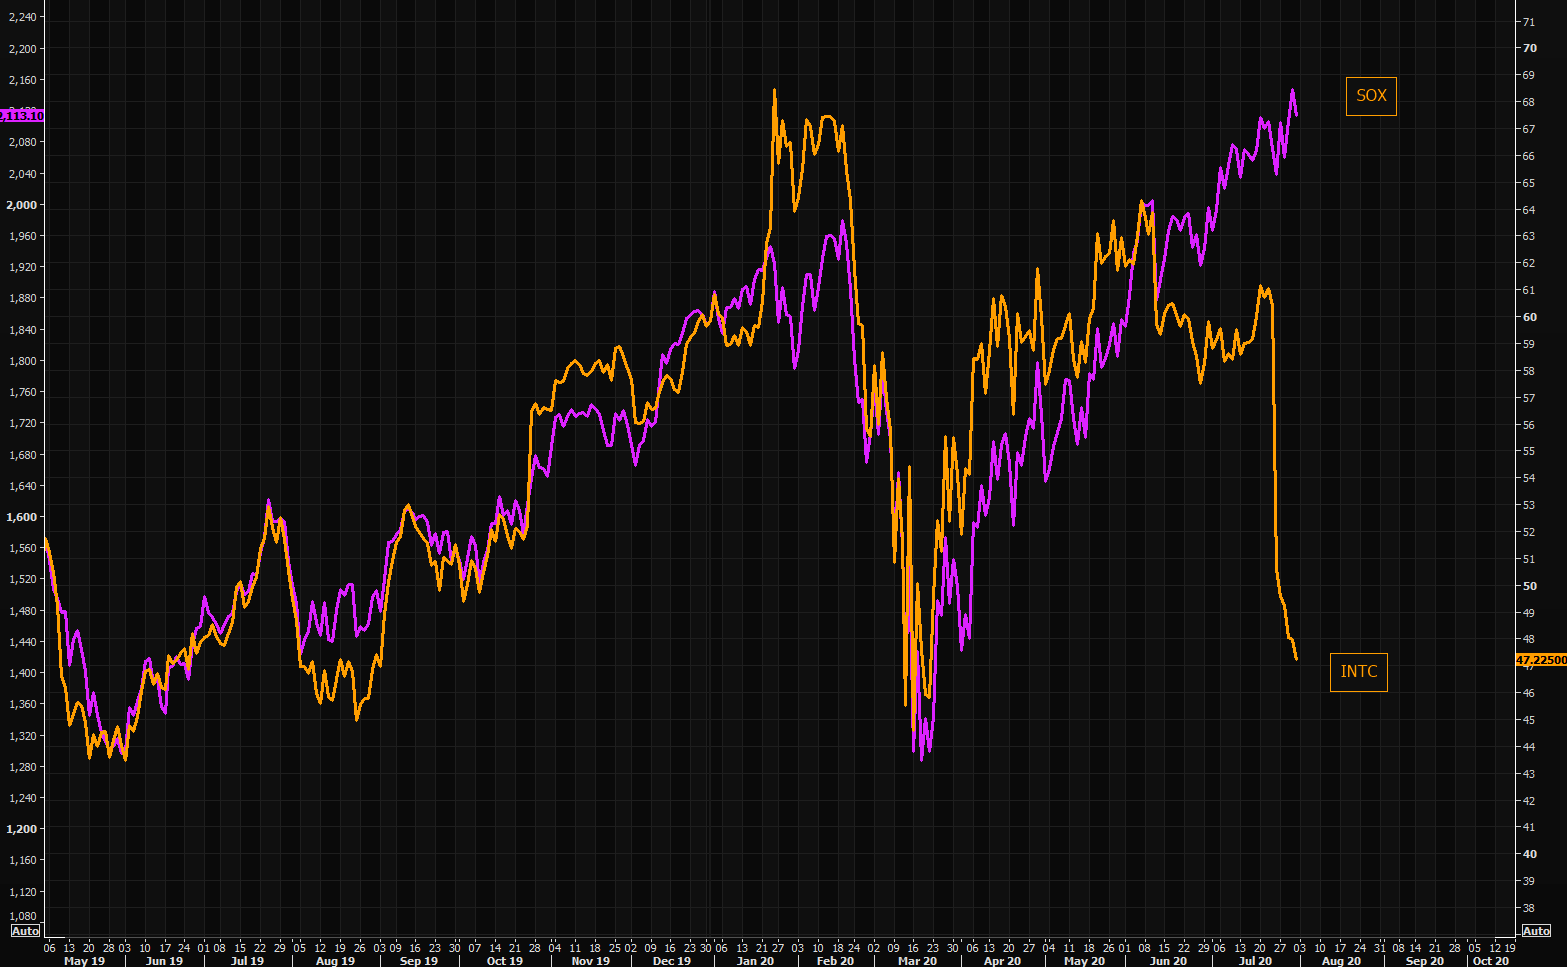
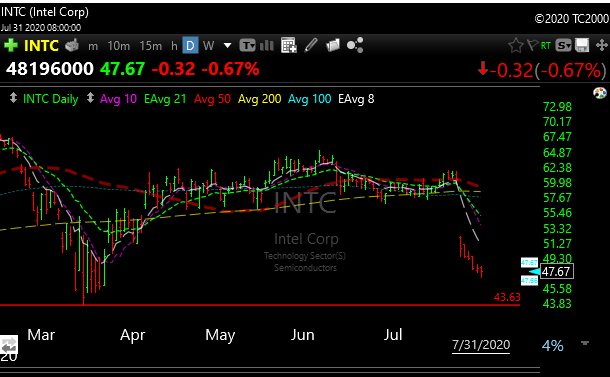
The chip stocks tagged more all-time highs Friday, but it’s a sad story for INTC. Look at INTC vs. SOX. With that said, you may have an amazing entry point on INTC here if you can put it away for 6-12 months. Maybe 3-4 points of risk max.
The sellers could get tired soon.
So what is the difference between the 2008-09 crash recession and this one? Makes me scratch my head….but waayyyyyy more Fed this time around.
Big tech returns in 2008 recession… MSFT-44% AAPL -57% GOOGL -56% AMZN -45% QQQ -42%
Big tech returns YTD in 2020 recession… MSFT +31% AAPL +45% GOOGL +11% AMZN +71% QQQ+26%
Looks like MSFT will buy the TIK-TOK. A little too late. China already has all the data.
How about this? Amazon has a B2B app in development that allows landlords to track packages to their units and gives suggested rent increases based on total Amazon spend. Nah, we’re fine, nothing to see here.
In other news, Zuckerberg said that working from home is the future. From Facebook’s earnings call: “50% employees to be remote in next 5 to 10 years. Not to save costs but to attract broader pool of talent”
How am I not short commercial real estate with both hands? Could be the short of the next decade, or am I being silly?
OK, thats enough macro…..
Here are some setups.
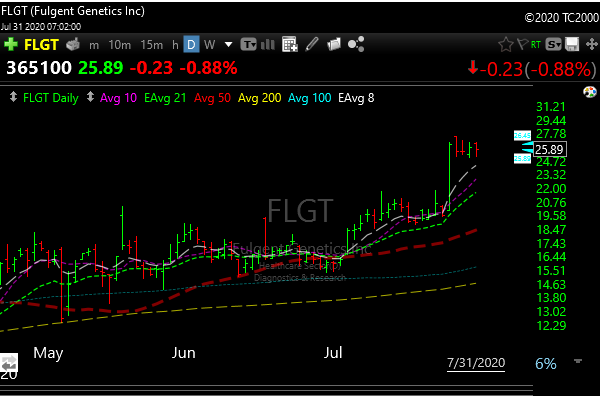
FLGT– nice bull flag. Through the 27 level, can tag 30.
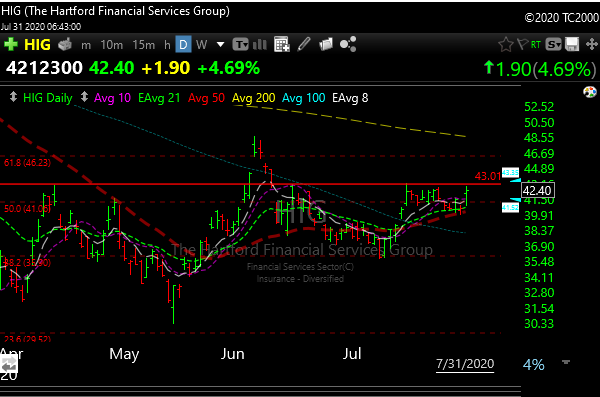
HIG– is looking good again after the pullback. Through the 43.50 level can run to 46-48. A lot depends on the financials overall, but the chart looks really good.
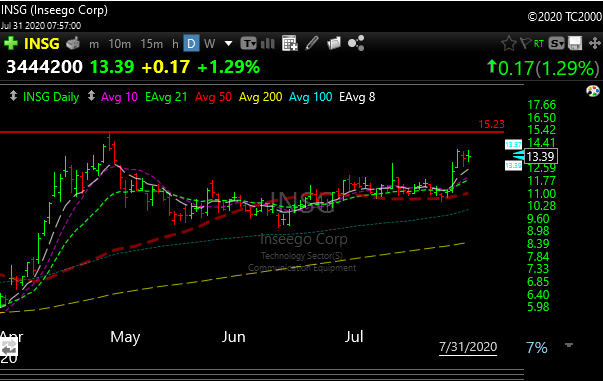
INSG– is sporting a nice bull flag. If it comes out of the flag then 15.25 would be the first target.
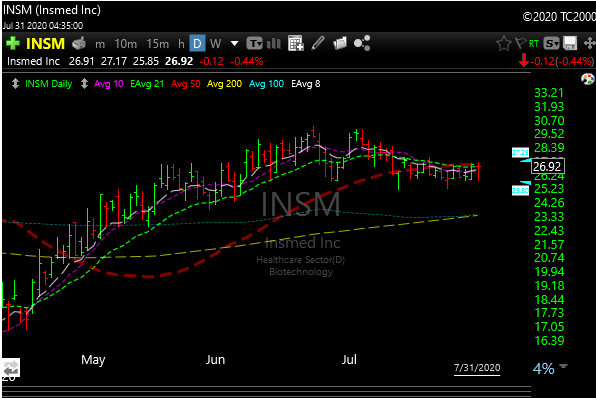
INSM– needs to get above 27.50, but technicals starting to improve. Target 30.
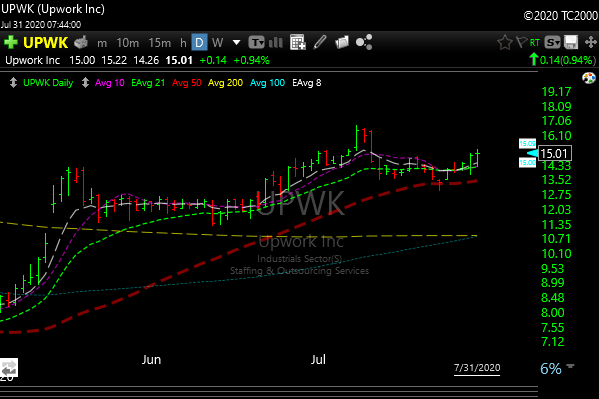
UPWK– setting up again. 17-18 targets
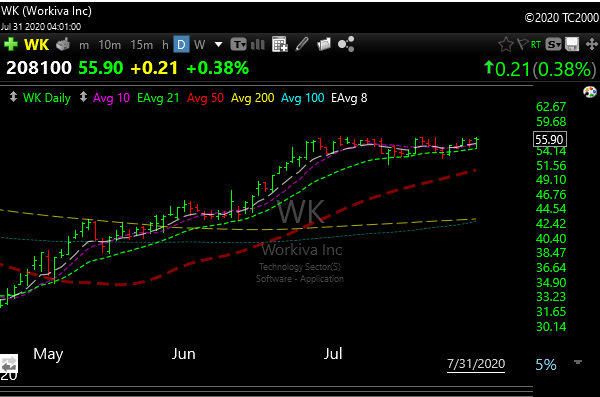
WK– coiling bullishly. Over the 56.50 level could tag low 60’s
Check earnings on the above names as I have not.