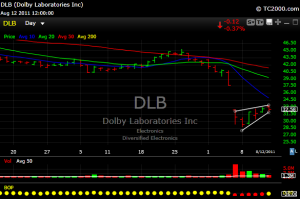
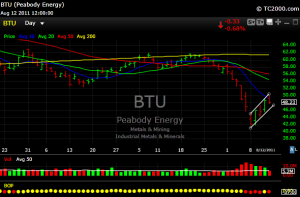
When markets implode as they have, and then rally ( sometimes on lighter volume), bear flags develop. It is a natural pattern after a deep sell off. It is a very bearish pattern, but it can be invalidated by a series of positive days or weeks accompanied by good volume.
Right now, we are in day two of the bounce. Day three may or my not result tomorrow. I wrote the other day that the lack of a follow through day to the upside, or at the very least a flat trading day on Friday, may invalidate Thursday’s big pop. So far the bulls hung tough on Friday, but it’s early.
I am not making a prediction on where the market will go this week, frankly I trust Casey Anthony with my kids more than this bipolar market. Here are some charts that should fail if the market rolls over in the week or weeks ahead as their bear flags are glaring and the recovery volume was less that stellar.
I did a piece on bear flag patterns on European ETF’s about a month ago. You can read it here and you will see how the patterns just completely imploded. Just look at the closing prices on your charts for Friday. A disaster.
Will the charts listed below repeat those patterns? Who knows, it depends on the market, but it certainly is something to keep your eye on. Good luck next week.
For further analysis with more thoughts for next week you can subscribe. If you have questions about my site or to request performance email: [email protected]


