Weekend Market Report with Setups
Friday
Dow: -201.81…
Nasdaq: +86.94… S&P: +3.82…
YTD
Dow -1.2% YTD
S&P 500 -2.2% YTD
Russell 2000 -3.7% YTD
Nasdaq -4.8% YTD
The S&P 500 gained 0.1% on Friday after being down 1.0% intraday, as the market overcame mixed bank earnings, downbeat economic data, and a sharp rise in interest rates. The Nasdaq (+0.6%) and Russell 2000 (+0.1%) also closed higher, while the Dow fell 0.6%.
The Nazzy still looks sick (down but not out), and there still does seem to be a rush to the door to sell tech and buy value.
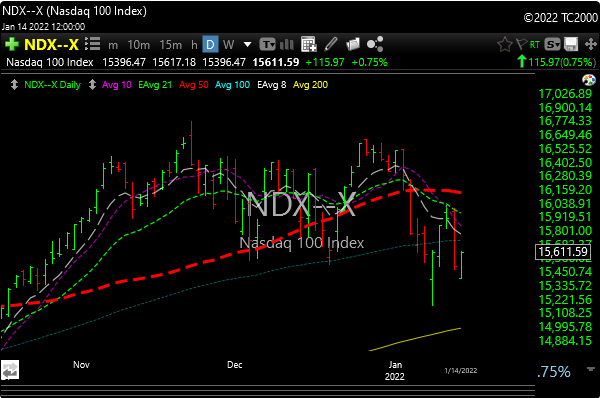
To put the Nazzy into perspective…………
A 40-60% decline would bring you back to 2019 levels.
A 70% decline would bring you back to 2017 levels. Not so bad in the big macro picture, but hurts like hell if you’re overexposed tech.
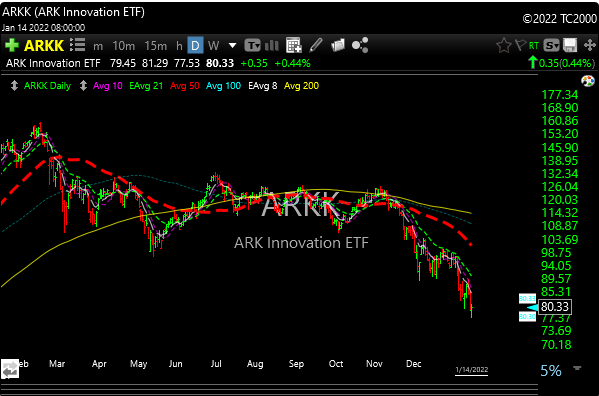
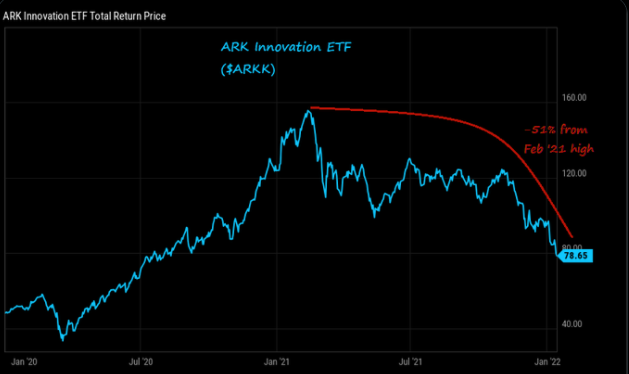
ARKK continues to get hit. So much growth tech in this ETF and very illiquid names too. This one could get much worse if there is another flush in Nazzy.
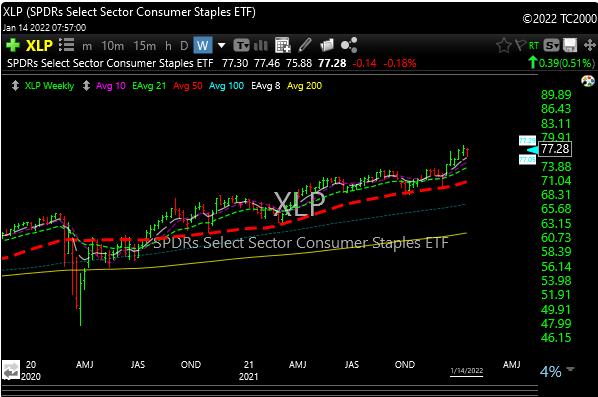
Value has been where the money is going. Is this the new theme for the rest of the year though? Chart bullish and looks higher.
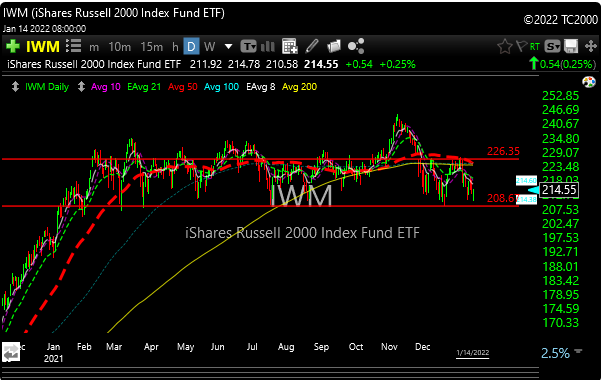
The Russell, which has been very frustrating, is close to going negative year over year and when that has happened in the past, the SPX has followed lower too. IWM has been in a choppy channel for over two months now and is approaching a significant support area.
There are a lot of doubters out there right now in the markets, especially on the tech/growth side of things.
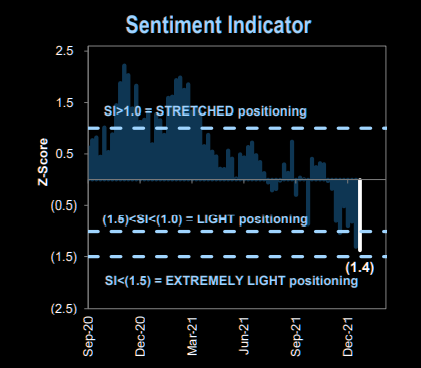
I have shown the chart below a lot as you know. The Goldman Sachs “Sentiment Indicator” measures stock positioning across retail, institutional, and foreign investors versus the past 12 months. Readings below -1.0 or above +1.0 indicate extreme positions that are significant in predicting future returns.
As you can see positioning is ‘extremely’ light. If you are a bullish contrarian you love this reading.
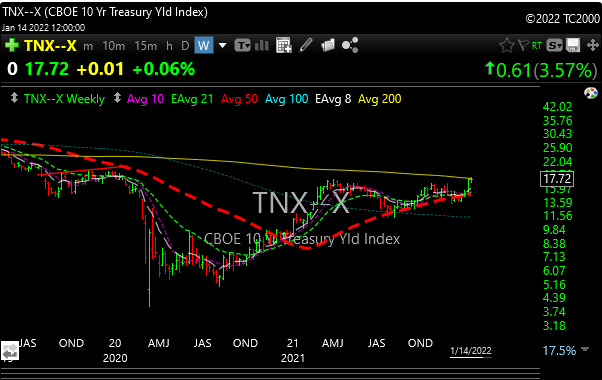
Although a bit extended, energy (XLE) still looks very bullish. Treasury rates are moving up (10-year, TNX right at 200-day ma resistance on the weekly chart), so that’s helping financials (XLF). A break above that 200-day ma on TNX could start a move toward that 2% yield zone.
There is a lot to unpack out there, so stock picking and being in the right sector is important. As always we’ll try and take it a day at a time because things can change quickly.
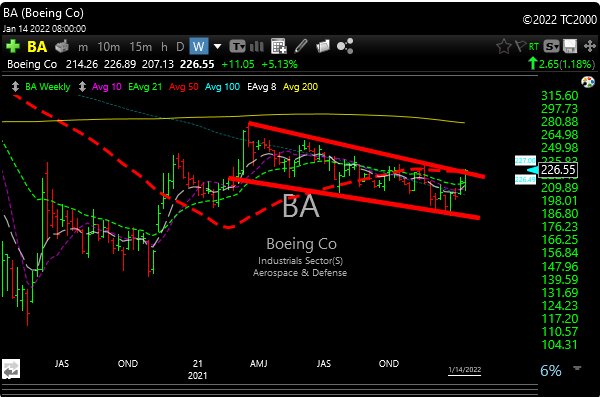
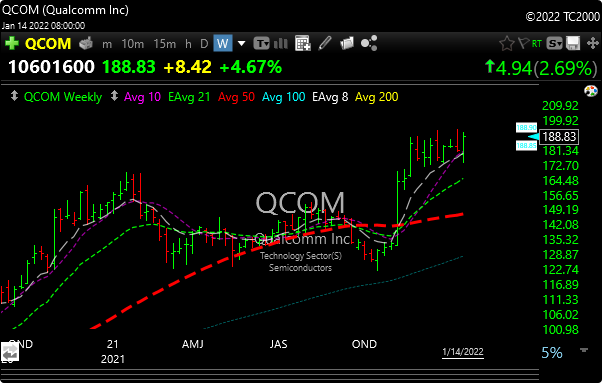
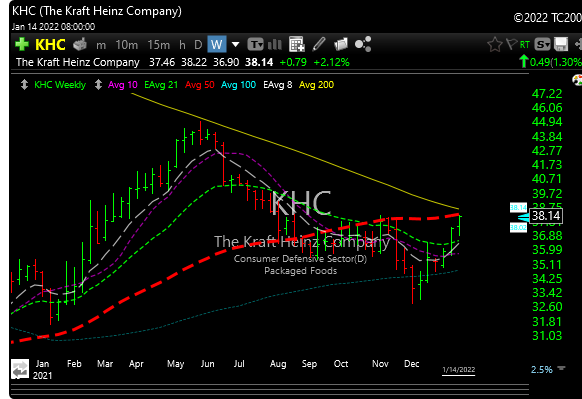
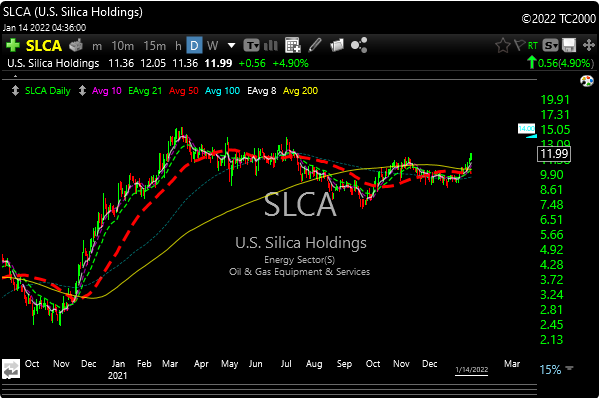
Here are three value plays on the weekly chart to give you some better perspective than the daily chart. All very bullish.
BA– Boeing had a problem keeping planes in the air and the stock was punished for it but the market gets amnesia, and now the chart looks like it’s ready to resume a move to the upside. Notice the bullish wedge.
QCOM– Bull flagging on weekly. $193 is the breakout spot.
KHC– Kraft/Heinz because ketchup and mac and cheese are defensive.
SLCA– Back to the oil patch. SLCA is setting up beautifully on both the daily and weekly charts. Targets $14.00 and 15.50
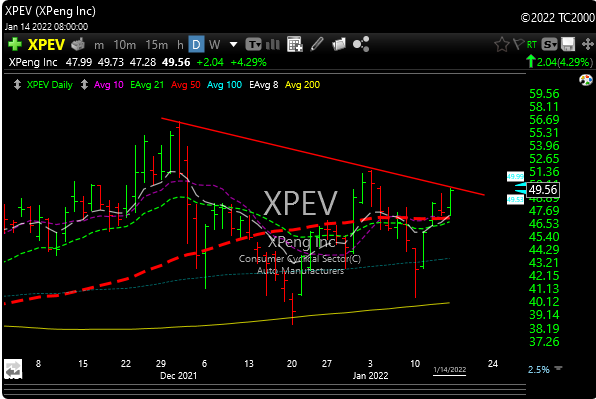
XPEV– Some of the EV stocks caught upgrades last week. I’ve mentioned NIO recently but XPEV also looks good. A move above 51.50 area with volume can target 56-57.
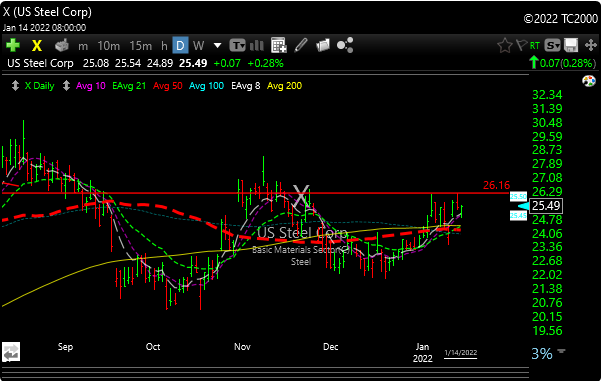
X– I’m watching a break of the 26.50 area for a resumption to the upside on this one.
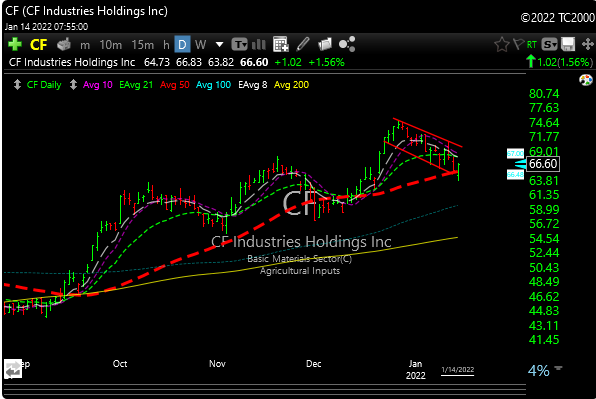
CF– Overthrew the 50-day ma but bounced back hard on Friday. Still like it a lot with a stop just below Friday’s low.
P&L here.
Hope you had a restful three-day weekend. See you in the morning.