1772
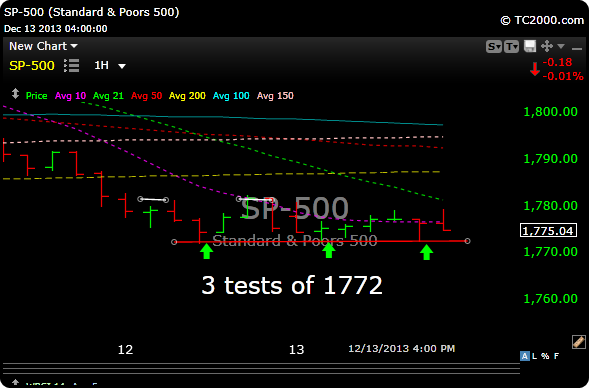
On the hourly view of the $SPX above, you can see that it tested the 1772 level three times between Thursday and Friday, so for my money, that’s your immediate and most short term line in the sand for support.
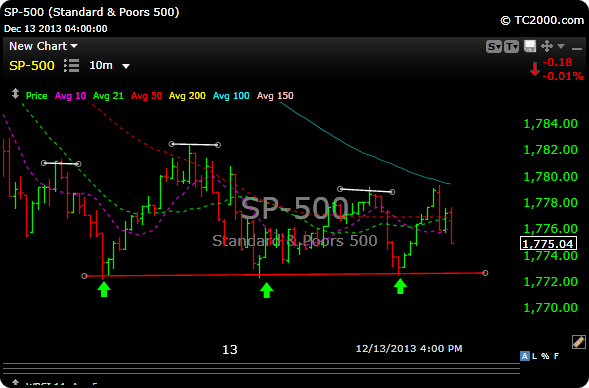
At one point Friday, the 10 minute chart was forming a head and shoulder pattern, and that 1772 level was actually the neckline. It held. See chart below.
If we lose that level, (1772), then 1760 and possibly 1749 will be next support.
In the meantime, some stocks don’t care about what the indexes are doing; see $TWTR, $FB , $ADBE, $MA and $QIWI.
Some names I’m watching next week:
$Z, $TRLA, $ZHNE, $QIHU
Good luck this week. You can grab a subscription here.