Yet Another Apple Moment, This Time It’s Resistance
Looks like Timmy Cook was on $AAPL‘s buy button on Friday as the stock popped. As the growth players leave the name and the value guys are in the process of valuing the stock, it is interesting to follow the chart as this has become quite a good “trading” stock.
The stock went into the wood chipper after earnings, but has managed a bounce. The question now is , where does it go from here on a short term basis….like next week.
If you look at the chart below, AAPL has come back to not only test the April 5 level (which was support at the time, now it’s resistance) around the 419.68 level, but it also traded to its 20 day moving average resistance on Friday and was rejected. It managed to trade about .67c above the moving average, but couldn’t manage a close above it. The 20 day moving average is 418.10. Will that be the smack down level for the stock, or will it breakout above that 418-419 level next week and make a move to the 50 day moving average up around 434? MACD is ever so slightly trying to turn up which may be bullish.
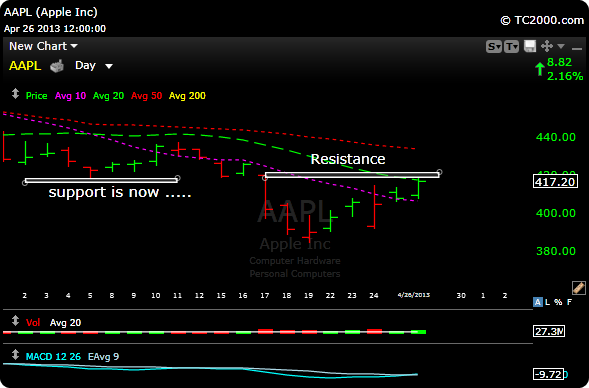
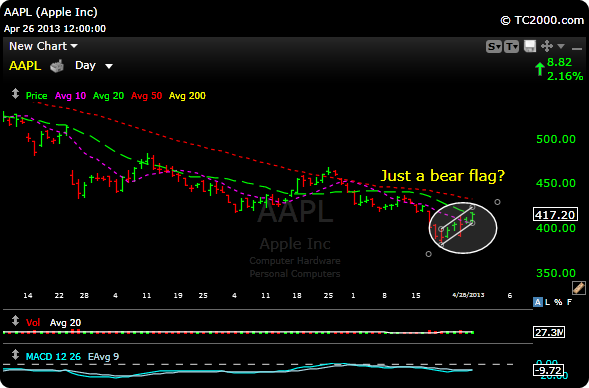
OR………….was this just a muted dead cat bounce that will start a retest back near the lows? Bear flag?
I will look to short it for a trade if the “fail” validates (fails to break above 20 day MA) or get long for trade if the stock can break above the 20 day with some volume.
You can grab a free trial HERE or request my performance HERE to see how we’re doing so far in April.
Have a great weekend.