You would never know it by looking at the major indexes, but there are hefty corrections going on right under our noses. The $SPX is only down 3% of its recent highs, the $NDX is down bout 4% and the Dow Jones $DJIA is down just about 2% from recent highs.
So why am I seeing sectors and individual names that have been coming down 10-20%. It all goes back to the sector rotation syndrome that I have talked about. The same money keeps sloshing around, moving from one temporary parking spot to the next. Rotational markets can be great trading markets, they can also be frustrating.
$AAPL has corrected about 70 points or 10% and $GOOG has pulled back about 62 points, almost 10% in the last two weeks.
Here is a look at some Sector ETF’s that look sickly: (You can click to enlarge the charts)
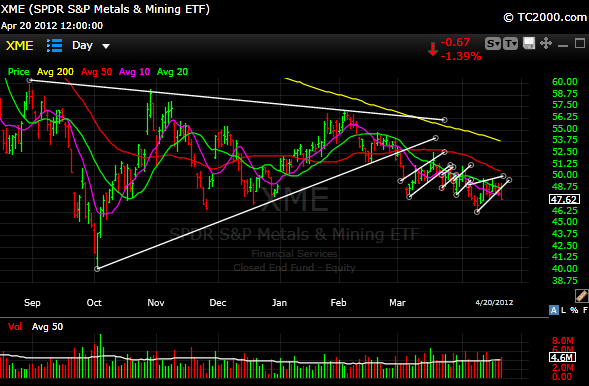
$XME has been in an ascending wedge since last August. The metals and mining group is breaking down. As you can see if broke its uptrend line on March 2 and has been in a series of mini bear flags/wedges (about 4 of them), and that last wedge to the far right looks like it’s breaking now.
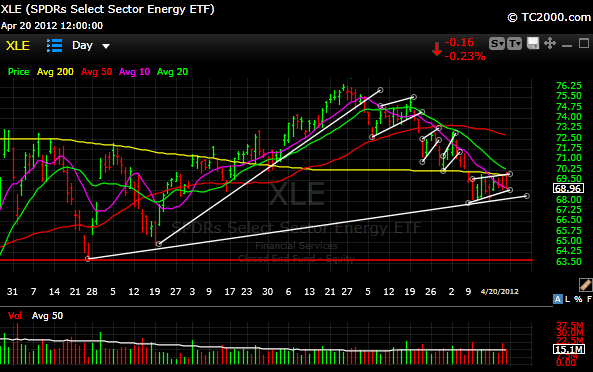
$XLE (energy) is in rough shape. Just brutal. So are some oil service names, just look at that bearish candle on $SLB on Friday, it speaks volumes. You can see that XLE topped back in late February. It also melted through its uptrend line around March 3 and has put in a series of bear flags (highlighted) that all broke lower. It is now testing an uptrend line that started back in November. Support is around 64 if things get uglier. Right now it really needs to hold and rally off that trend line around 68.
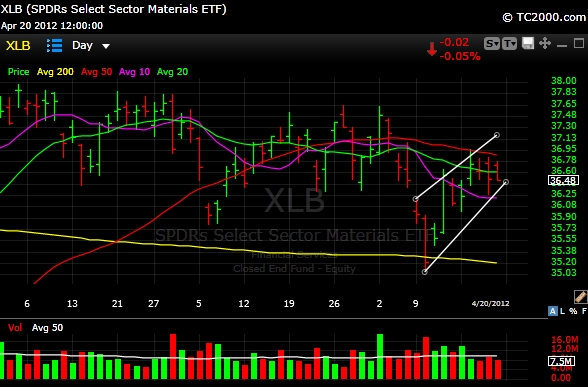
$XLB (materials) I’m not sure if that is a mini bear flag or not yet. Short term we will find out, but is managing to successfully fail at its 50 day moving average. Look for that white uptrend line to hold, because if doesn’t, the 200 day moving average is around 35 and there is gap that may need to get filled down around that level too.
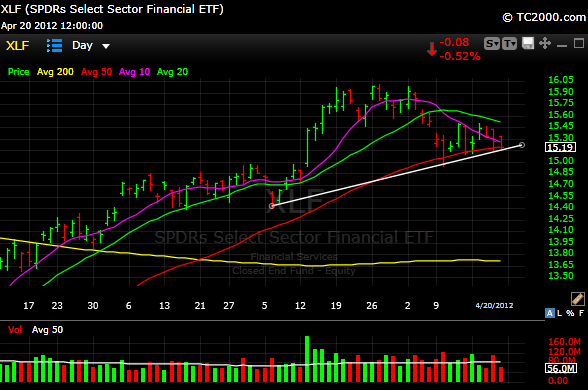
$XLF… The financials have some price support as well as trend line support right here, however a break could take it down to the 14.50 level.
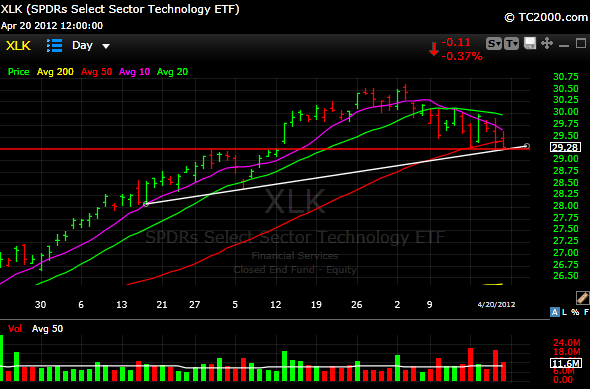
$XLK Technology is sitting on trend line support right now ( but has had two consecutive closes below its 50 day MA). $AAPL & $GOOG haven’t helped this, but $MSFT seems to be getting much of the “scared” tech money lately. I think a lot of the success or failure of this one will depend on AAPL next week. Support around 28.
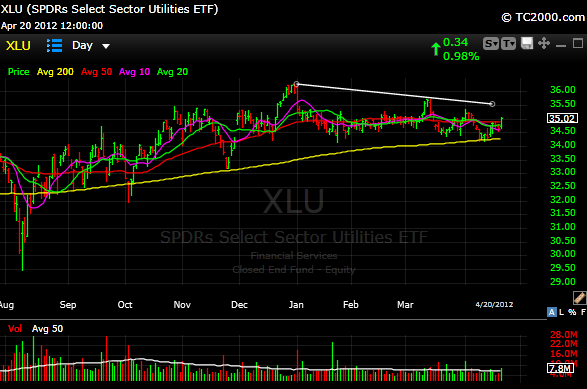
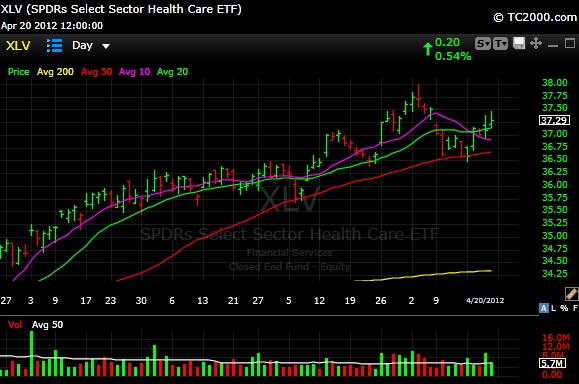
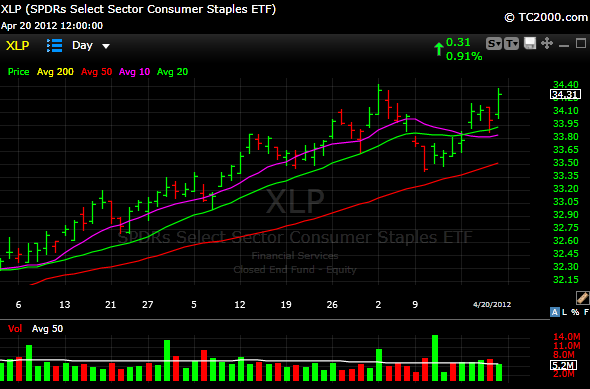
So here is what is working higher: healthcare, staples and utilities. It’s where money goes to hide when folks get nervous.
$XLU Utilities got hammered, but held the 200 day moving average. It still needs to get above that white downtrend line to validate a continued move higher, but money has been moving back in this sector over the last couple of weeks
$XLV Healthcare is acting well and is another “defensive” sector.
$XLP Consumer Staples This is the boring stuff, $KO, $PEP, $KFT etc, but boring can pay the bills. Also a defensive sector.
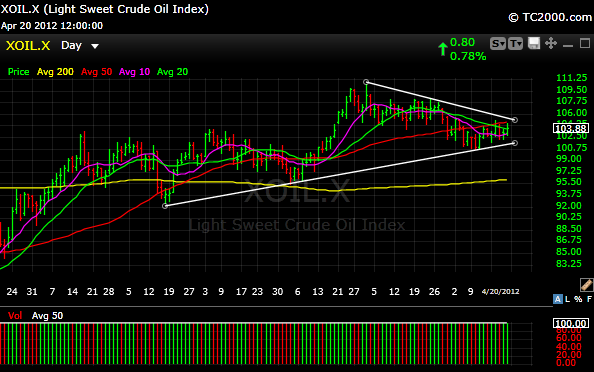
$UCO Crude (the light sweet variety) is caught in a triangle. Personally I think its range bound between 95-110.
This tape can still go much higher and buying dips has been the way to go, but just in case, know your levels.
I will getting into these sectors with more specificity and drilling down on individual stock set ups on my weekly Sunday Premium video. You can subscribe here. Have a great weekend.
Joe

