The financials are in day six of their uptrend. In this morning’s blog post I mentioned some resistance level. The 50 day moving average is 12.57 and as you can see the $XLF came within four pennies of that number before it was rejected.

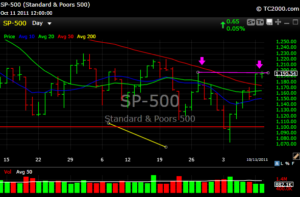
As you can see by the pretty pink line, we are at a level, let’s say 1196, that if broken to the upside, could launch to the the S&P to the 1225-1230 level. The market looked tired today, but it may just be a consolidation day before the bulls fully impale the remaining shorts. Earnings go full swing next week so expect a chop fest. A good number, a bad number, you know the drill. $SPX $SPY

The big Nazzy $NDX closed just above the 200 day simple moving average on the daily chart. 2340 may be the next stop if the bulls cooperate.

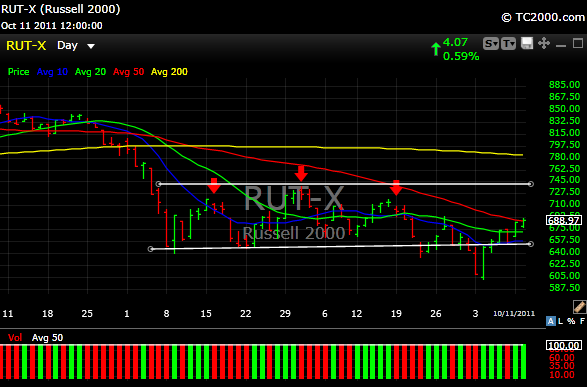
The Russell $RUT $IWM broke the neckline of that head and shoulders pattern back in early October, has since reovered and closed just today above its 50 day simple moving average. A target of 718 is possible, weather permitting.

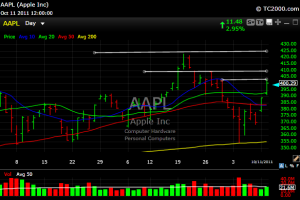
$AAPL is trying to get back some of its glory and has rallied 46 points since it tagged the 200 day moving average support (yellow line) back on Oct. 4. It is up 22 point since yesterday morning. The white lines are the next levels of resistance and earnings are on October 18 after the close.
P.S. The whole thing could go in the wood chipper real fast if Europe misses one step. They better be flawless going forward.
If you would like to see more detailed analysis, my track record, or more information about my Premium Site, just email: [email protected]
