{+++}

Profit takers attempted to reverse early gains that were spurred by better-than-expected economic data, but an underlying bid helped stocks rebound to finish at their best levels in months.
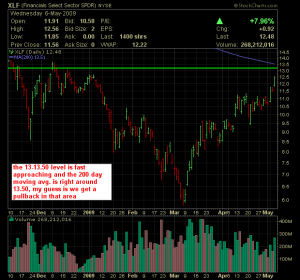
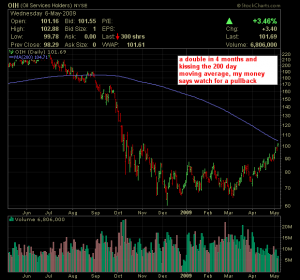
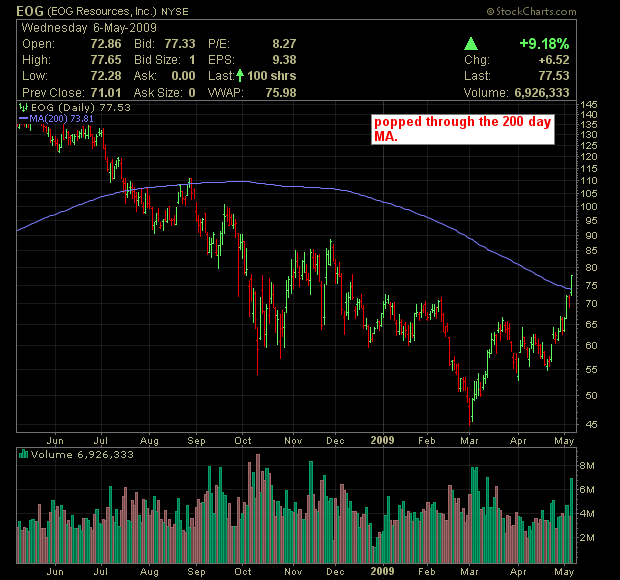
Financials logged the best gains of any major sector in the S&P 500 by advancing 8.1%. Energy also made a strong gain; the sector climbed 3.6%, helped along by advancing oil prices. Oil closed pit trading 4.6% higher at $56.34 per barrel, which marks its highest closing level since mid-November.
Today was a crazy day, I didn’t do one trade until about 1:30 PM and I’m glad I waited. I don’t think I have been that inactive for a very long time, but nothing was jumping out at me until early afternoon when the stress test results started to leak out. When it was announced that Wells Fargo needed $15 billion and traded aggressively higher, I kind of got the hint that the market was spinning this positively. Then came Citi, State Street, Mellon Bank, Morgan Stanley and a few others including Met Life. This was all hours after the N.Y. Times reported (erroneously) that BAC needed an “additional” $35 billion. The news wires were screwy overnight and in the early morning and when the correct information was properly disseminated BAC came off the pre -market lows and went green, however it wasn’t until about 1:30 that we caught lightening in a bottle.
On this mornings blog I suggested that it was time to take profits in the financials, it was based on that eroneous news realease, however, in all honesty my tune really isn’t much different even after the news. The beauty of the market is that it gives you the opportunity to change your mind, good traders go with the flow of money, not headlines. Later in the morning I posted a chart of the XLF on twitter when the stock was $12, calling for the possibility of a move to $13 based on the formation, shortly thereafter it exploded to 12.60. The chart is on the list below and I will be giving you more of these, a few times a week, and i will do a snapshot of exactly what I saw and why I did the trade. It is really the only pattern I ever use, the 5 minute time period with the 20 day simple moving average.
I opined on twitter after the close that the energy space was trading like they closed the Straits of Hormuz and that banks were trading like they were actually making money, but neither are true. Right now the playbook and fundamentals must be thrown out the window and it is more important than ever, at least in my eyes, to just “trade the tape”, because nothing is rational. You can still m ake a lot of money in this environment but you’re kidding yourself if you try and figure out the “why” of the market right now.
How are you doing with the picks? Let me know, these names are exploding so please take profits, still a traders market, and PLEASE watch for earnings on these names, it’s a tricky time when earnings report,example PBI, the formation was beautiful but the eps disappointed and they took it down a few. It will get easier in a week when earnings are out of the way.


