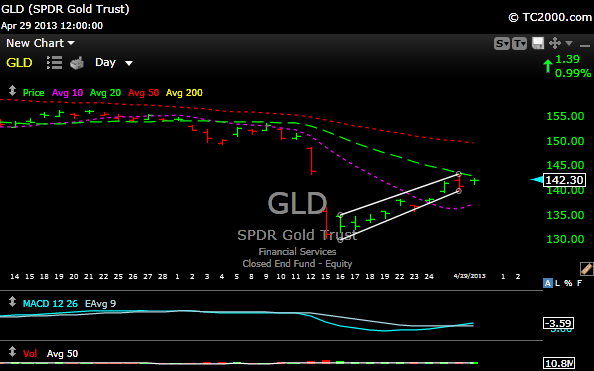
I was just looking through my charts and noticed an interesting similarity with $AAPL and $GLD. The GLD chart today is exactly where the AAPL chart was on Friday. On Friday, AAPL saw resistance at its 20 day simple moving average and today, GLD finds itself with the same set up. On Saturday, this was my way to trade it.
Here is the chart of AAPL, notice the close, just about a buck under the 20 day MA. on Friday.
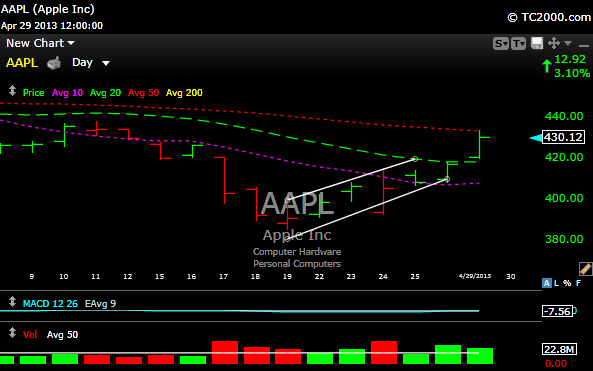
Below is the chart of $GLD. Just like the MACD had started to turn up on AAPL, the same exact thing is happening with GLD. It, like AAPL, also got turned away from its 20 day simple moving average.
I hate gold and think its a silly investment. If you want to be hedged, take the 10% you would put in gold and put it in cash. Play make believe.
Anyway, GLD may die here at its 20 day moving average, BUT, like AAPL, if it can bust above that 20 day MA with volume it could be a “TRADE”. On the other side of the coin, like AAPL, if it fails to break above that 20 day ma, it’s a short.
Subscribe here