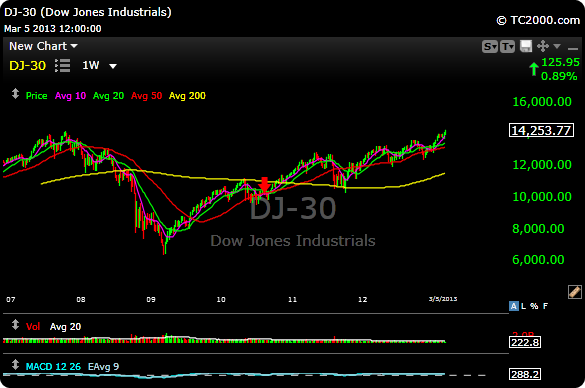
Then and now…last time DOW was at 14164 vs now at 14164 – Oct 2007 vs March 2013
- Dow Jones Industrial Average: Then 14164.5; Now 14260
- Regular Gas Price: Then $2.75; Now $3.73
- GDP Growth: Then +2.5%; Now +1.6%
- Americans Unemployed (in Labor Force): Then 6.7 million; Now 13.2 million
- Americans On Food Stamps: Then 26.9 million; Now 47.69 million
- Size of Fed’s Balance Sheet: Then $0.89 trillion; Now $3.01 trillion
- US Debt as a Percentage of GDP: Then ~38%; Now 74.2%
- US Deficit (LTM): Then $97 billion; Now $975.6 billion
- Total US Debt Outstanding: Then $9.008 trillion; Now $16.43 trillion
- US Household Debt: Then $13.5 trillion; Now 12.87 trillion
- Labor Force Particpation Rate: Then 65.8%; Now 63.6%
- Consumer Confidence: Then 99.5; Now 69.6
- S&P Rating of the US: Then AAA; Now AA+
- VIX: Then 17.5%; Now 14%
- 10 Year Treasury Yield: Then 4.64%; Now 1.89%
- EURUSD: Then 1.4145; Now 1.3050
- Gold: Then $748; Now $1583
- NYSE Average LTM Volume (per day): Then 1.3 billion shares; Now 545 million shares
$DJIA